PriEsT Beginner’s Guide
Download as PDF
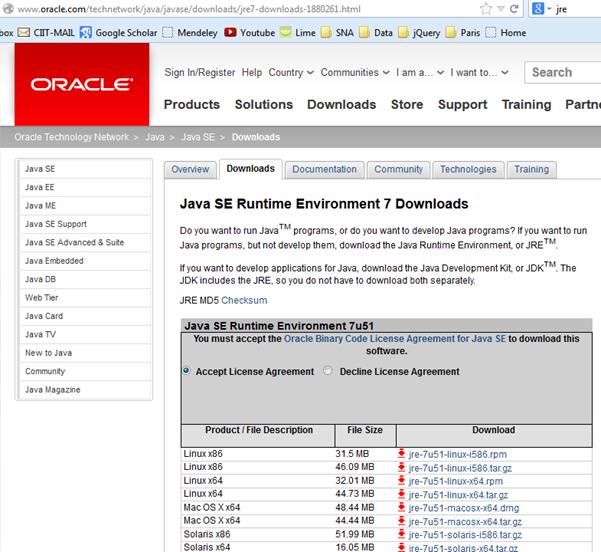
Prerequisite: Install Java Runtime Environment
Please note that PriEsT requires Java Runtime Environment (JRE), therefore you must install it on your system if it is not already installed.
Go to Oracle website to download the latest version of JRE for your machine, and install it on your system.

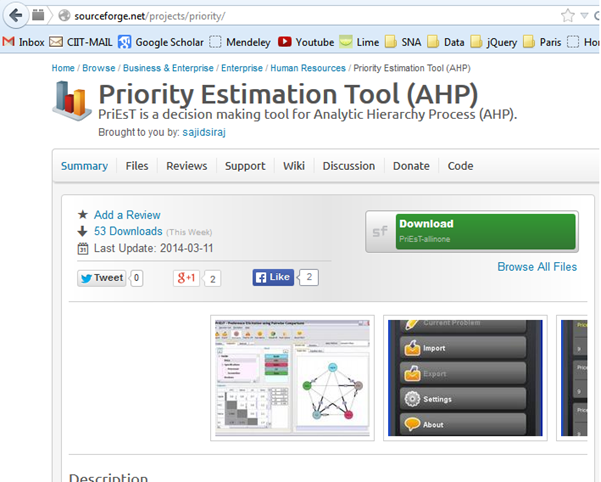
Downloading PriEsT from SourceForge.net
Go to the following website and download the file PriEsT-allinone.zip:-
http://sourceforge.net/projects/priority

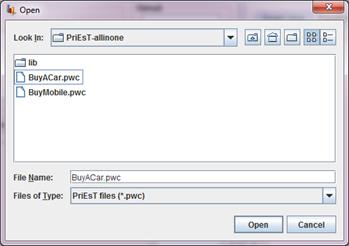
Extract the PriEsT-allinone.zip archive. You should see the following set of files in the extracted folder:-
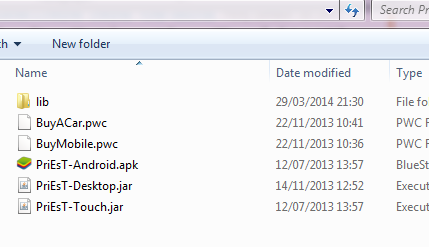
The file names are self-explanatory, for example, the three versions of PriEsT are for desktop, android, and for those devices with touch input. In addition to these three files, two example files are provided to help you quickly evaluate and understand the use of PriEsT.
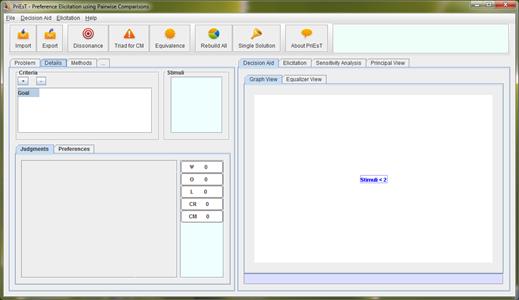
Using PriEsT on Desktop Computer
PriEsT can be opened by simply double-clicking the “PriEsT-Desktop.jar” file in your browser. However, if this does not work, please open a console (also called command prompt) and type the following command:-
java -jar PriEsT-Desktop.jar
Following screen should appear in a few seconds time:-
To give it a quick evaluation, you may like to open an example file of “BuyACar.pwc” which is provided with in the PriEsT archive.
Next, we will show how to create a new file from scratch.
Defining a new problem from scratch
Consider a hypothetical problem of projects prioritization. We assume that a city council has five projects to be completed in different time and involving different costs. They need to revise their resource allocation and the order of prioritization every month due to multiple reasons, for example, changing conditions and limited resources.
The five projects are P1, P2, P3, P4, and P5. Their prioritization criteria are perceived benefits (Benefit), estimated cost (Cost), potential opportunities (Opportunity), and involved risk (Risk).
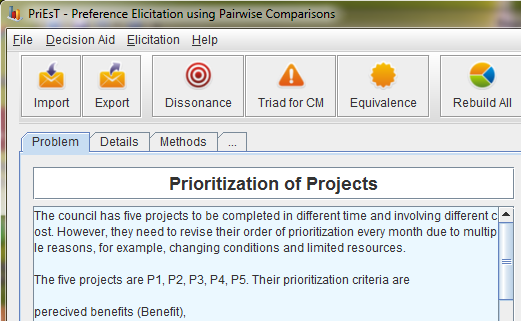
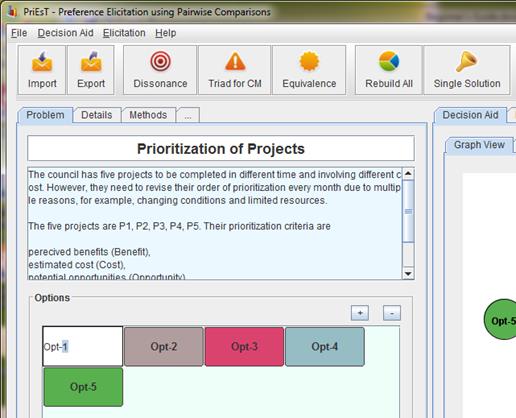
To define a new problem, click on the “Problem” tab as shown below:-

Enter the title of your decision problem, and a short description about the problem for the purpose of documentation. Entering this information is an optional step.
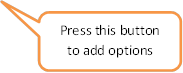
After entering the title and description, just below the description text box, all the available options/alternatives can be added one by one, using a “+” button on the right side, as shown below:-
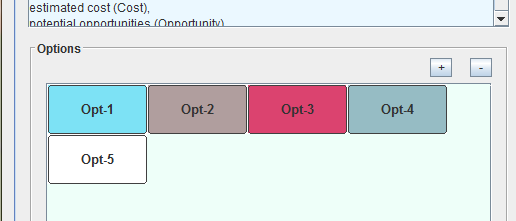
Each option/alternative can be renamed by double-clicking on it. By default, each option is named Opt-x where ‘x’ is a number (with auto-increment policy).
For our example problem, let us rename the five options to the names of five projects i.e. P1, P2, P3, P4 and P5. You may notice that a graphical view appears on the right side of the application window. There should be 5 nodes with no connections at all.
Now is the time to think about those criteria that really matter in this case. For example, we assume that the four criteria are perceived benefits (Benefit), estimated cost (Cost), potential opportunities (Opportunity), and involved risk (Risk).
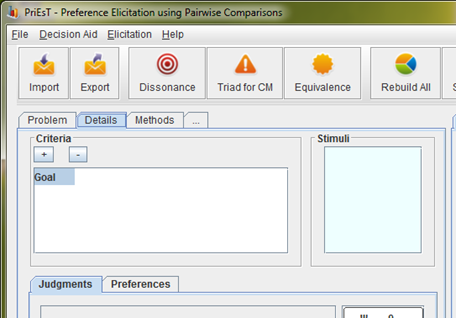
Click on the “Details” tab to see the following screen again:-
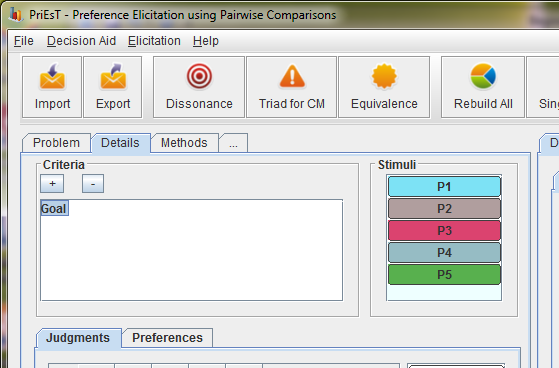
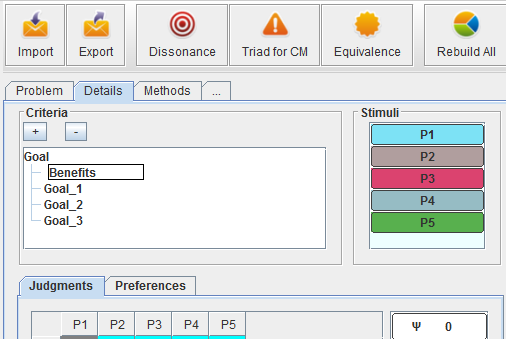
Rename the captions of newly created criteria; for example, change Goal_0 to Benefits, and so on.

Now that the options and criteria are listed, the next step is to enter your judgments. In AHP, all the evaluations are carried out with the help of pairwise comparisons.
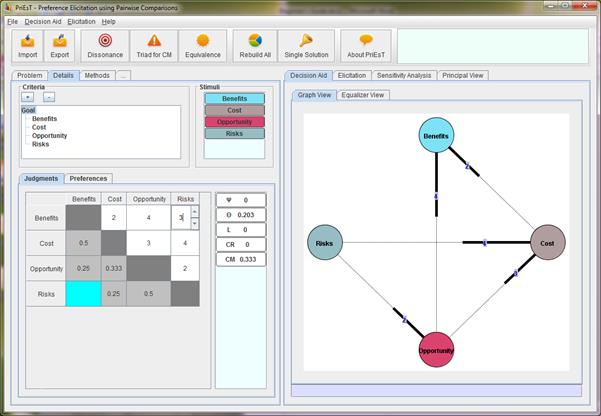
Click on the top criterion “Goal”, and enter your judgments in the table just below the list of criteria, as shown in the figure below.

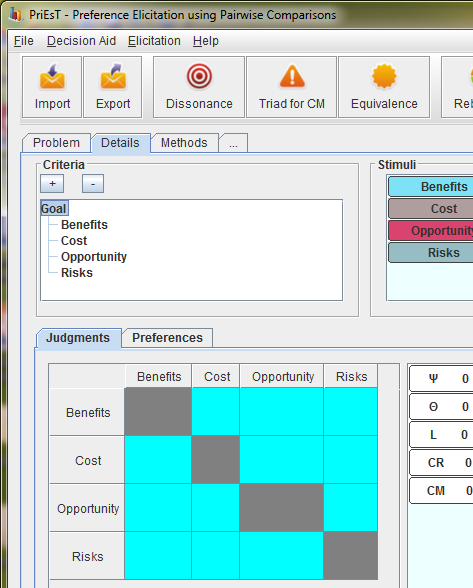
The blue cell implies that this judgment has not been provided. Grey cell implies that no judgment is required here. For example, in the above mentioned problem, Benefits versus Benefits are considered to be an unnecessary comparison for obvious reason (self-comparison).
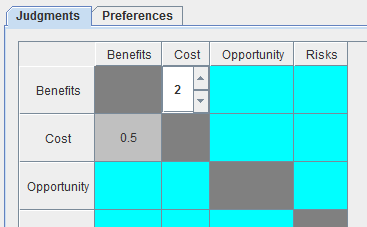
Please enter all the judgments carefully, as wrong judgments will lead to wrong results. In the example shown below, the entry of 2 implies that Benefits are considered twice more important than the Cost of any project. Considering the reciprocal property, this judgment also implies that Cost is half as important as Benefits are.
Keep filling in all the entries. On filling each entry in the table, PriEsT will also update the graphical aid on right side, as evidenced below:-
This table was to compare the criteria with each other.
Next, you need to evaluate projects with respect to each criterion, one at time. After entering all the judgments in the four sub-tables, you are ready to generate results.
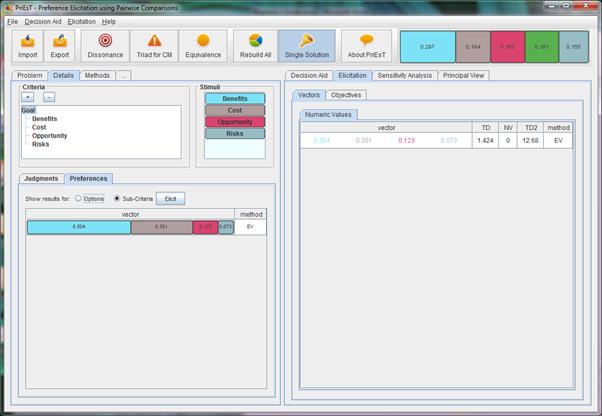
In order to calculate results, click on the top-criterion “Goal” and press “Rebuild All” from the toolbar menu above.
 |

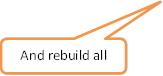
If you are interested in more details, then click on the “Elicitation” tab on right side of the main window. This tab can be used to analyse numerical values of the generated solutions, and also to compare different solutions from different methods/techniques.
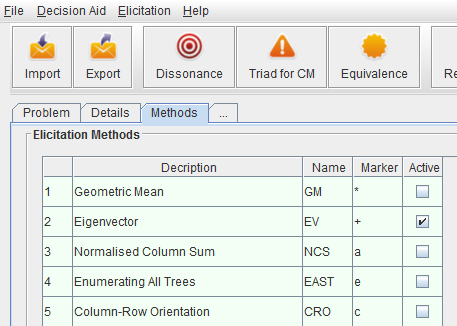
You can edit/change the prioritization methods from the “Methods” tab

You can save the whole problem and the results in an xml file by clicking “Export” button. Similarly, you can load the model/problem again using “Import” button.
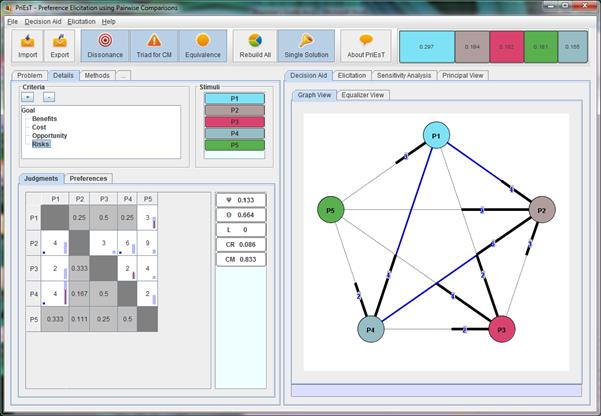
 Another
interesting and quite useful feature of PriEsT is to analyse the level of
inconsistencies in our judgments. The level of inconsistency in your judgments
becomes visible when you press the “Dissonance” button on toolbar. For example,
Another
interesting and quite useful feature of PriEsT is to analyse the level of
inconsistencies in our judgments. The level of inconsistency in your judgments
becomes visible when you press the “Dissonance” button on toolbar. For example,
This is not the end… Some of the unique PriEsT features include:-
1. Multi-objective optimization approach to generate Pareto-optimal set.
2. Sensitivity analysis using three different methods.
3. New prioritization methods to handle incomplete data.
4. New measures for inconsistency.
A simple one-at-a-time sensitivity analysis example can be seen below:-
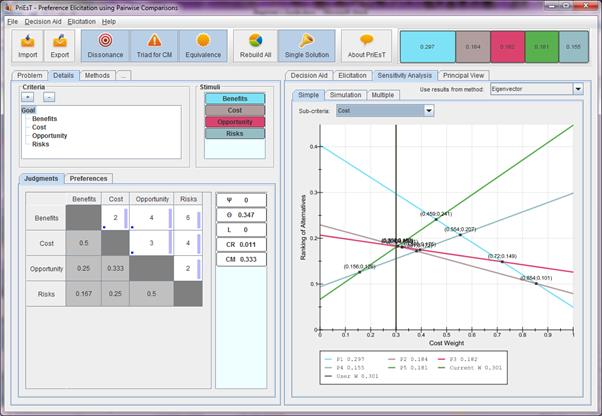
In this picture, we can clearly see that the “Cost” criterion has a critical role in changing the overall ranking i.e. Increasing the weight of Cost (above 0.459) will make P5 as the best candidate, and P1 has the chances of becomes the least important candidate, if the weight of Cost goes above 0.854.
I hope that this tutorial will make the software easier to use and understand.
Best of luck,
Sajid Siraj